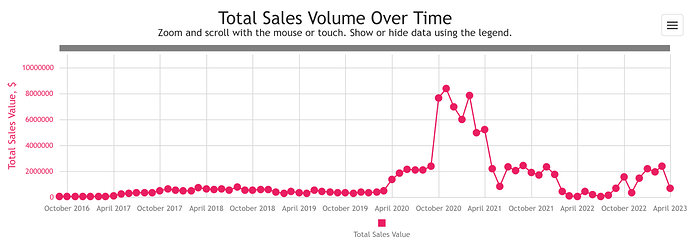
Source: Pokemon Price - Analytics - Total Sales Volume Over Time, @dunsparce0p
Good times for sure
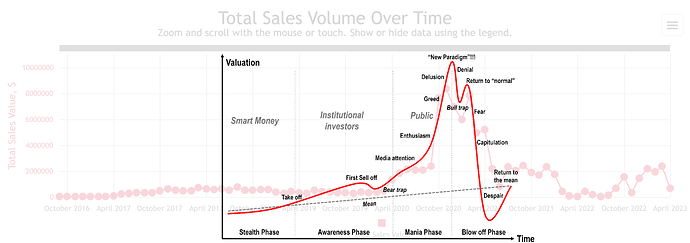
Can we make prices a bubble too? You know. Like go into denial so I can get some gold stars for below pre-pandemic prices?
I always assumed that 2020 and the early parts of 2021 were a bubble. It still hard for me to find any cards near me, but you don’t see mobs of people constantly in the card area doing mental math on how much to resell ETBs at least.

Can someone map this onto the Japanese card craze rn. I need to plan when to sell
It’s crazy how the pandemic imho had an effect on almost every hobby, from pokemon cards to old consoles & games, from gardening to trading stocks/crypto. It would be awesome if someone with time and skill could compare all this data and get a bigger picture.
Ton of free time + excess of money and savings (due to people not traveling/hanging out and growing inflation) = deadly combo
Also being closed at home totally legitimized all these geeky activities, that the average person didn’t even like or had forgotten.
Funny, cause all the cards I want these days are 10x what they were in 2019/early 2020.
Same! It’s why blanket terms like “bubble” are worthless without context.
Speaking of context, pokemonprice hasn’t been regularly updated now for years. The data is not as comprehensive as it was in the beginning.
Definitely a lot of money thrown around in all assets in 2020/2021. Record low interest rates, WFH savings, government handouts, huge nostalgia wave, massive supply glut at PSA/BGS… it was the perfect storm for collectibles across the board it seems. I started buying some cards again in late 2021 and have been buying a lot more in 2022. So far my vintage has been pretty stable the past 6-12 months and I’ve seen growth in my modern collection.
I really feel now vintage has become a pretty good value again and most are bearish on it compared to modern. People would have thought vintage was a gold mine if we had these prices in late 2020 that we have currently.
Anyway, what I do know, I just really enjoy all these cards regardless of the booms and busts that have happened over time. I look forward to seeing where it heads over the coming years.
Same same. Alot of cards are really really expensive
For many of the more common cards, the peak has already passed. Gotta sell now before the market gets flooded. ![]()
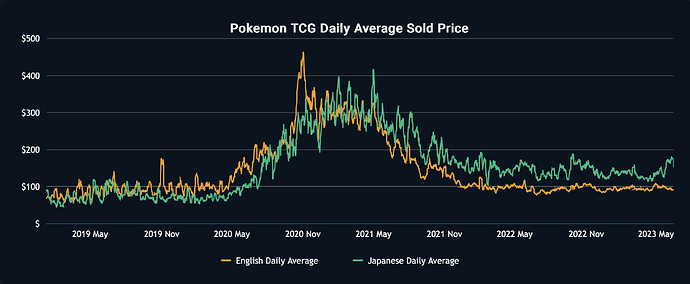
actually, there is a lot of things behind the average sold price.
The total sales # Number
and the total sales value
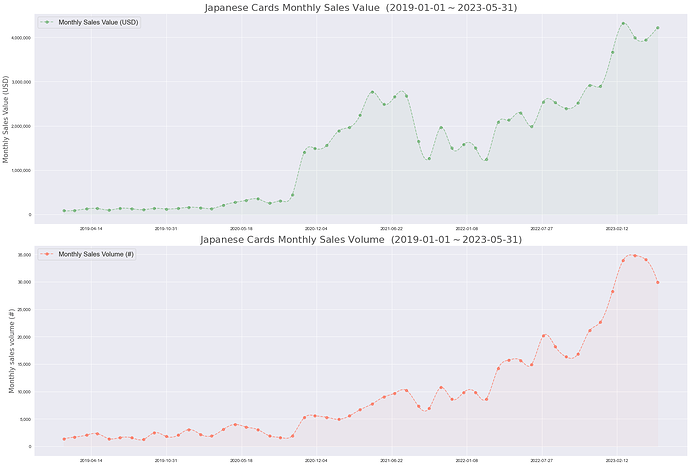
Here is the tcgfish version, I’m only posting data up to 2023 May, but you can feel the trend,
The Following chart is for Japanese cards only.
These graphs are helpful in understanding monthly spending behavior, but I think the more interesting information would be at a different level.
For example:
- Is the average PSA 10 Vintage English card more or less expensive now than during the boom?
- Is the average PSA 10 Modern English card more or less expensive now than during the boom?
- Is the average PSA 10 Vintage Japanese card more or less expensive now than during the boom?
- Is the average PSA 10 Modern Japanese card more or less expensive now than during the boom?
Sure I was just letting people know as the owner is a member here and they stopped updating it awhile ago.
Certain segments of the market were certainly in a bubble. But I think it’s fair to say that certain segments weren’t (or at least they haven’t yet popped lol). There are many things that are currently higher than they were during the “bubble.” I’ve been trying for a while now (with no success) to find a Ruby box for <$10k. But in late 2020, I could’ve easily found one for that price.
Arguably, that sort of item is the exception rather than the rule, though. Most stuff that increased during the pandemic has cooled down significantly.
Higher highs, higher lows
What websites are you guys using to get those graphs?![]()
